
- senior Statistics major, with an Analytics co-major
- minor in Chinese
- from Cleveland, OH
- participates in client-based projects at Center for Analytics and Data Science
- interned at Cleveland Clinic, working on data visualization and predictive modeling projects (Summer 2017, 2018)
- working with Butler County's coroner and health commissioner on opioid crisis and infant mortality, using data visualization techniques
- studied abroad in London through the American Institute for Foreign Study (Winter 2018)
"Take advantage of the opportunities that Miami offers. By working with faculty inside and outside the classroom I've received so many opportunities and gained a wide range of experiences, and it was so easy to pick and choose what I was interested in."
Why Miami?
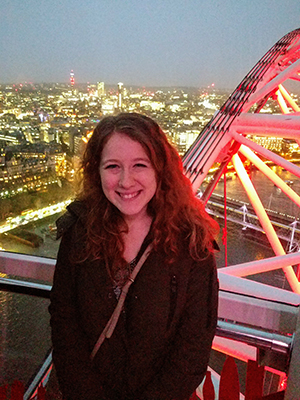
Bri Clements takes a break from her studies in London.
"This may sound like a fake story, but it's not. In a matter of just a couple weeks, a bunch of people separately told me I'd be a perfect fit at Miami. Being from Cleveland, I wasn't familiar with Miami, but I decided to schedule a tour.
"My dad is an engineer, so he's very logical, but his advice to me was that some of the biggest decisions come to you instantly as a feeling — you just know it's right. And within the first 5 minutes of my campus tour, even though it was a cold, wintry day, I knew Miami was home. I could see myself spending my next 4 years here.
"Freshman year was all about transitions and trying to figure out where I fit and understanding myself more. I was already interested in statistics and analytics, but at first I'd thought I wouldn't be able to take a stats class right away because most are 400-level. But at Miami you get to jump right into your majors, so I was actually able to take two stats classes my freshman year, STA 363 and STA 401. They were definitely hard, but I learned a lot and liked that I was challenged — it felt good to know that this was what college is all about!"
Best Miami Experiences
"My statistics major and analytics co-major have found a natural connection between CAS and the Farmer School of Business (FSB), and although I haven't yet narrowed down ultimately what I want to do, I know they're preparing me for a great career. Statistics provides a lot of options to combine my skills, and I've worked on client-based projects that allowed me to both be creative in data visualization and build predictive models and code.
"The two faculty members who have influenced me the most are John Bailer, professor and chair of statistics, and L. Allison Jones-Farmer, Van Andel Professor of Business Analytics in FSB and the former director of the Center for Analytics and Data Science (CADS). They're both really driven people who have done incredible things during their careers, and they've always taken the time to give me great professional and personal advice despite being some of the busiest people I've ever met.
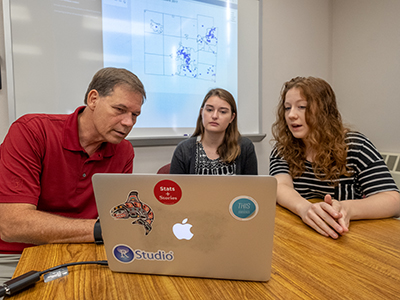
Professor John Bailer and classmate Katherine Shockey listen to Bri Clements while she discusses their research.
"I've been engaged in two different independent study projects. One was focused on the Butler County opioid epidemic, in which I worked closely with Dr. Bailer, classmate Katherine Shockey, and Butler County Coroner Lisa Mannix, and the second involved automating PDF reports for Miami's Scripps Gerontology Center. Last fall I also started working with Dr. Farmer, Dr. Bailer, fellow CADS student Nichole Rook, and the Butler County health commissioner on a project examining infant mortality, where we try to understand why, on average, African American babies have been dying more frequently than white babies here in Butler County.
"I've also had two summer internships at Cleveland Clinic. One project there involved creating an alert system for doctors and nurses for when certain patient cost variables were too low or too high, and another was predictive modeling to demonstrate what interventions high-risk patients need based on data from past patients. In both cases, I've been in team meetings where we talked about, almost word-for-word, what we talked about in some of my stats classes."
Miami and the Liberal Arts
"I like taking classes that are not necessarily in my wheelhouse. I discovered a lot of different interests, so I would feel limited if I could only take classes related to my major. Thankfully, that's not the case — I get to minor in Chinese! I wouldn't say I'm fluent, but I can communicate fairly well with some of our international students, and that's really exciting for me. It's not a skill I would have picked up if I had gone to a different university.
"I love painting and graphic design, so some people may wonder how I ended up in statistics, which feels like the opposite end of the spectrum. It comes down to the fact that I like trends, patterns, and repetition. Data visualization provides a way to make data 'pretty' and approachable, so that's what led me towards statistics, which is about predicting what will happen next based on past data. You can work in any industry and solve many different types of problems."
Visualizing Depth and Complexity of the Opioid Crisis at a Local Level
"I learned so much in my STA 404 data visualization class, taught by Dr. Bailer. It felt like I was in the real world, not a classroom, because we got to work on client projects. This is where my project on the Butler County opioid epidemic started, and it has opened up a lot of doors for me.
"I was really interested in the opioid epidemic because it is a serious nationwide issue, and I want to help my local community get to a point where we understand it better. I partnered up with Katherine Shockey, one of my classmates, to develop an interactive app for our client, the Butler County Coroner's office. I decided to take the project a step further by setting up an independent study with Dr. Bailer to produce something deliverable to the client.
"The Butler County coroner, Lisa Mannix, provided us with all kinds of data for our project. Once we worked out the story it was trying to tell, the visualization for the website (Overdose Deaths in Butler County, 2013-2017) we built came naturally. Feedback was very important in making this into an effective online tool. I love taking data and turning it into a picture that people can more easily understand. [See the Miami May 2018 press release Student-developed web app explores overdose deaths in Butler County.]
"These projects showed me how much I loved working in a close partnership with clients. The iterative process of hearing feedback and building something according to their needs is great — we're figuring it out together to make the product the best that we can. My experiences with my statistics classes and CADS have helped me line up a job after I graduate this spring: I'll be working at Columbus Collaboratory, which helps companies with analytics and cybersecurity challenges. My new position will give me exposure to clients from many different industries, so I am super excited about this opportunity!"
Advice to Students
"My advice is pretty simple: take advantage of the opportunities that Miami offers. By working with faculty inside and outside the classroom I've received so many opportunities and gained a wide range of experiences, and it was so easy to pick and choose what I was interested in. Just saying yes and putting myself into these opportunities has really opened a lot of doors for me. I can't imagine not saying yes now!"
[April 2019]
 Miami University Oxford, Ohio est. 1809
College of Arts and Science
Miami University Oxford, Ohio est. 1809
College of Arts and Science


