Scientific/Technical Reports
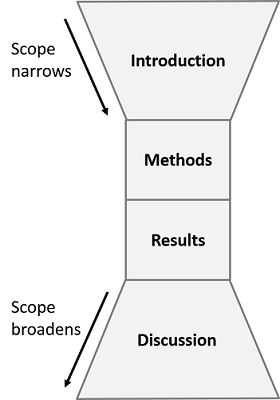
A scientific, engineering, or technical report informs readers about research you've conducted. (In your science classes, they may be called Lab Reports). These reports often follow the pattern explained here and as shown in the figure to the right, though the section titles and organization can vary by discipline or type of information you're reporting. Remember that your audience, content, and purpose should inform the way you present and discuss information.
These general guidelines may differ from the instructions provided by your professor or TA. ALWAYS follow your professor's or TA's instructions for writing scientific reports!
Introduction
Your introduction should justify that the study is important and worth conducting. It should have the following general structure:
- Begin with the general topic and describe the important "big picture" problem in the field.
- Provide appropriate and relevant background information with progressively narrower scope that provides context and justification for the study. Your background information should
- Connect the big picture to your research question
- Justify the logic and importance of the research question
- Set your research within the context of other research
- Reference relevant published studies and identify gaps and unresolved issues that this study addresses (references are always paraphrased, never quoted).
- Include only relevant information related to the crucial concepts of the study.
- End by stating your research question, your study purpose/goal, and/or any hypotheses/predictions.
Common Pitfalls
- Lack of focus: The introduction provides too many irrelevant details or lacks important concepts/details.
- Lack of organization: The introduction does not follow the structure listed above.
- Failure to justify the study: The introduction does not persuade readers that the study is worth doing and/or the reasoning behind the hypotheses is unclear.
Introduction Checklist
- Begins with the most general topic ("big picture") and progressively becomes narrower in scope.
- Provides appropriate background information that justifies why the study is worth doing. For example, you might introduce the importance of the problem by identifying a gap in previous research, inconclusive results in previous research, or the need for additional information.
- Includes only relevant information related to the crucial concepts of the study.
- Ends by introducing the study's purpose and clearly stating any hypotheses and predictions.
Methods Section
Your methods section should demonstrate that the research approach was appropriately designed and implemented, so that your audience trusts the results and so you establish your credibility. It will cover the details of your study, such as the following:
- Ways you addressed the research question/hypothesis
- Important materials used in the investigation (quantities, equipment, organisms, databases)
- For person-based research, the data collection method (interviews, surveys, observation, etc.), number and demographics of participants, etc.
- The outcomes/responses that were measured and how
- Any calculations (including formulae) and statistical tests used
- Any details that, if changed, would substantially alter the results
Common Pitfalls
- Lack of organization: The methods are written as a play-by-play of what happened in the lab ("first, we got scissors, and then we cut the plants"), or the same procedure is described multiple times.
- Lack of detail: Follow the bulleted list above for necessary details to include.
- Unnecessary details: You can leave out details regarding safety (e.g., wearing gloves); common scientific practice (e.g., labeling, being careful); and steps that, if changed, would not alter the results (e.g., the class being broken up into groups).
Methods Section Checklist
- Thoroughly describes the procedure used to address the research question/hypothesis.
- Includes all relevant details (e.g., quantities, equipment, organisms, data collection method, etc.).
- Describes all calculations used (including formulae and definitions of the variables).
- Avoids being repetitive (i.e., describing the same procedure multiple times).
- Avoids unnecessary details.
Results Section
The results section organizes and simplifies the findings of the study for readers and presents objective explanations.
- Focus on the details that are most relevant for evaluating the study question/hypothesis.
- Begin paragraphs with topic sentences to describe a general pattern in the data. Then, describe the finer nuances of the data.
- Make comparisons and describe trends when appropriate (e.g., this increased faster than that, or this treatment was consistently lower than the others, etc.).
- Reference tables and figures within the text.
- Avoid any interpretation of or explanation for the results.
Common Pitfalls
- Lack of organization: Paragraphs lack topic sentences, or the order in which results are presented is confusing or difficult to follow.
- Lack of important details: Fails to describe patterns in the data (see examples above) or fails to describe results for the entire experiment.
- Too many details: Too many numbers can be hard to follow and boring to read.
Results Section Checklist
- Describe important trends and provide relevant numerical values.
- Refer to all tables and figures within the text.
- Avoid interpretation of results.
- Avoid unnecessary details.
Discussion Section
The discussion section interprets and explains the study's results.
- Start by stating the overall conclusions with respect to the study's goals/hypotheses.
- Justify the overall conclusions by relating the results to the goals/hypotheses (why did you conclude this?).
- Interpret and explain the results by
- Providing explanations using relevant disciplinary concepts
- Comparing the study's results to other groups in class or to published studies
- Suggesting improvements on the experimental design and/or proposing ideas for future research
- Conclude by discussing the implications of the results with respect to the "big picture" issue mentioned in the introduction.
Common Pitfalls
- Shallow data analysis: The analysis and explanation of the results is weak and lacks depth. Explanations may focus too much on human error rather than scientific or other disciplinary phenomena.
- Weak ideas for improvements or future research: Fails to explain how a design improvement might affect the results, or how a proposed study would advance understanding of the topic being addressed.
Discussion Section Checklist
- Starts with a statement of the overall conclusions with respect to the study's goals/hypotheses
- Briefly describes the results that led to the above conclusions
- Provides explanations of the results using primarily disciplinary concepts
- Explains how the results compare to other groups in class or to published studies (if applicable)
- Provides logical explanations for unexpected results or results that differ from published studies
- Explains how the study could be improved (if applicable) and how that might affect the results.
- Provides well-reasoned ideas for future research that would further understanding of the topic.
- Concludes by discussing the implications of the results with respect to the "big picture."
Tables and Figures
Tables and figures should help the reader visualize and understand your results.
- Focus on the most relevant results for evaluating the study question/hypothesis.
- Include enough information so readers can interpret the tables/figures on their own.
- Number tables and figures in the order in which they are referenced in the paper.
For help with Excel or statistics software, visit the Statistics Help Desk in BEST library.
Common Pitfalls
- Confusing or disorganized tables/figures: Readers should easily understand the data presented in a figure or table.
- Improper formatting: Table or figure does not conform to format described below. Titles are vague and uninformative.
Table Formatting Checklist
- Columns and rows are clearly and concisely labeled and include units (e.g., mm) where appropriate (see example below)
- Data is neatly organized and easy to understand
- Table titles clearly and completely describe the data being presented (see example below)
Table 1. Physical characteristics of three bird species sampled in Oxford, Ohio. Values represent the average (± 1 standard deviation).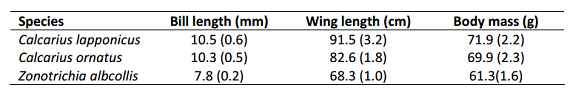
Figure Formatting Checklist
- X- and y-axes are clearly and concisely labeled and include units (e.g., mm) (see A below)
- When multiple lines are graphed in the same figure, the lines are easy to distinguish and the key clearly shows what each line represents (see B below)
- Figure titles clearly and completely describe the data being presented (see example below)
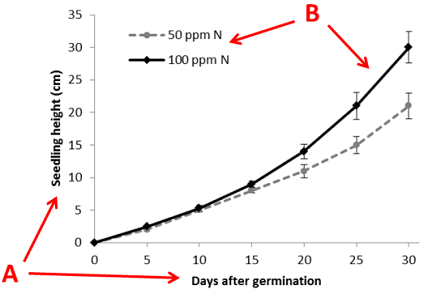
Figure 1. Change in the average height of corn seedlings treated with different concentrations of soil nitrogen. Error bars indicate the standard deviation.